
Why Power BI Projects Fail Without Data Modeling
The most skipped step in data work, and the number one reason projects quietly fall apart.

Hey friends, Happy Tuesday!
Let’s talk about the most skipped step in data work: data modeling.
No hype, no shiny tool, nobody makes content about it. And honestly? It’s the number one reason data projects fail. Not just Power BI reports. Pipelines, warehouses, lakehouses, all of it.
People connect the data, run some transformations, and jump straight to building. The model? Skipped.
Weak model = weak project.
So I just started what I think is the most important chapter in the whole Power BI course. Like always, we build it the right way, step by step, with the sketches.
The Trap: One Big Flat Table
Someone asks for a report. You connect the source, grab the columns you need, and dump everything into one big flat table. Add a few DAX measures, build the report, share it. One or two weeks of work.
And honestly? It feels great. You’re fast, you’re flexible, the report works, the user is happy.
But here’s the trap:
One big table is not a data model.
It’s fine for one small report. But Power BI projects never stay small. The data grows, the users grow, the requests keep coming. And that one table starts breaking things everywhere.
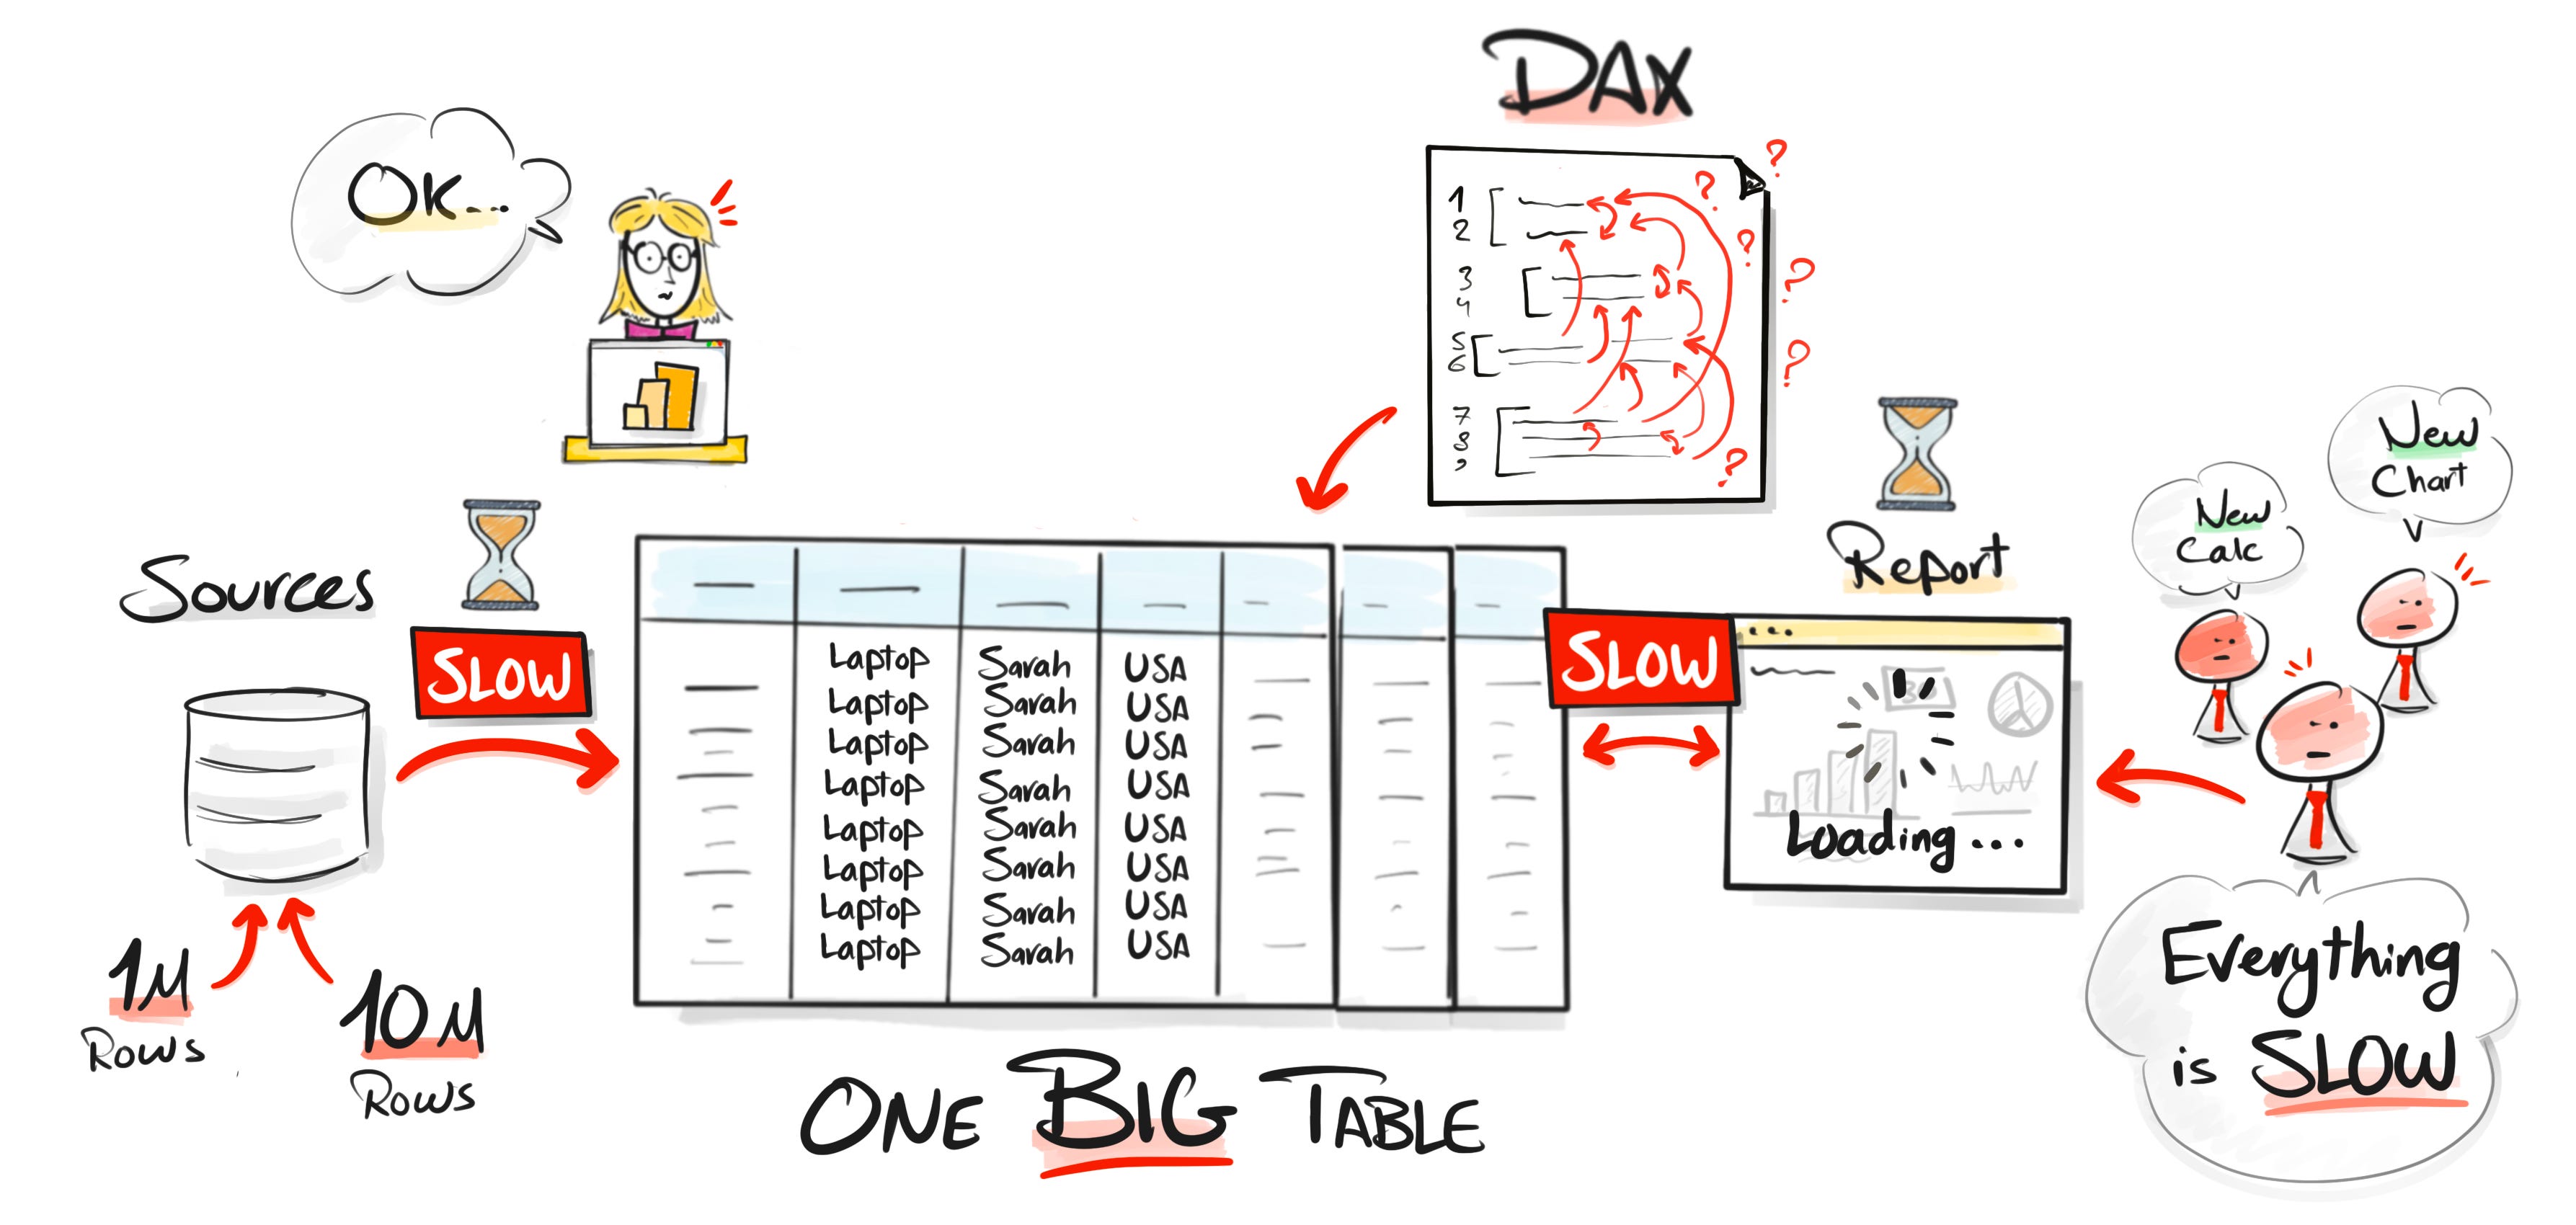
Here is why:
#1: The file gets huge. With 10,000 rows you won’t feel a thing. But push it to a million, ten million rows, and the same information repeats on every single row, over and over. You’re storing the same text thousands of times instead of once. The file blows up for no good reason.
#2: Refresh gets painful. Once the file is huge, the refresh follows. What used to take a few minutes turns into 30 minutes, an hour, more. Now just getting fresh data into Power BI is a daily fight, and every fix takes longer to test.
#3: Reports get slow. Every time a user clicks a slicer, Power BI has to scan that giant table to build the visual. So the report drags. And in real projects users aren’t patient. If it doesn’t open in two or three seconds, they don’t say “the model needs work,” they say “Power BI is slow,” or worse, “this project is bad.”
#4: DAX gets ugly. Most people think they’re bad at DAX. They’re not. The one big table is forcing them into complicated formulas. A measure that should be one line becomes ten, because you’re twisting things just to get the right number.
Bad data model = complicated DAX.
How a Real Model Fixes It
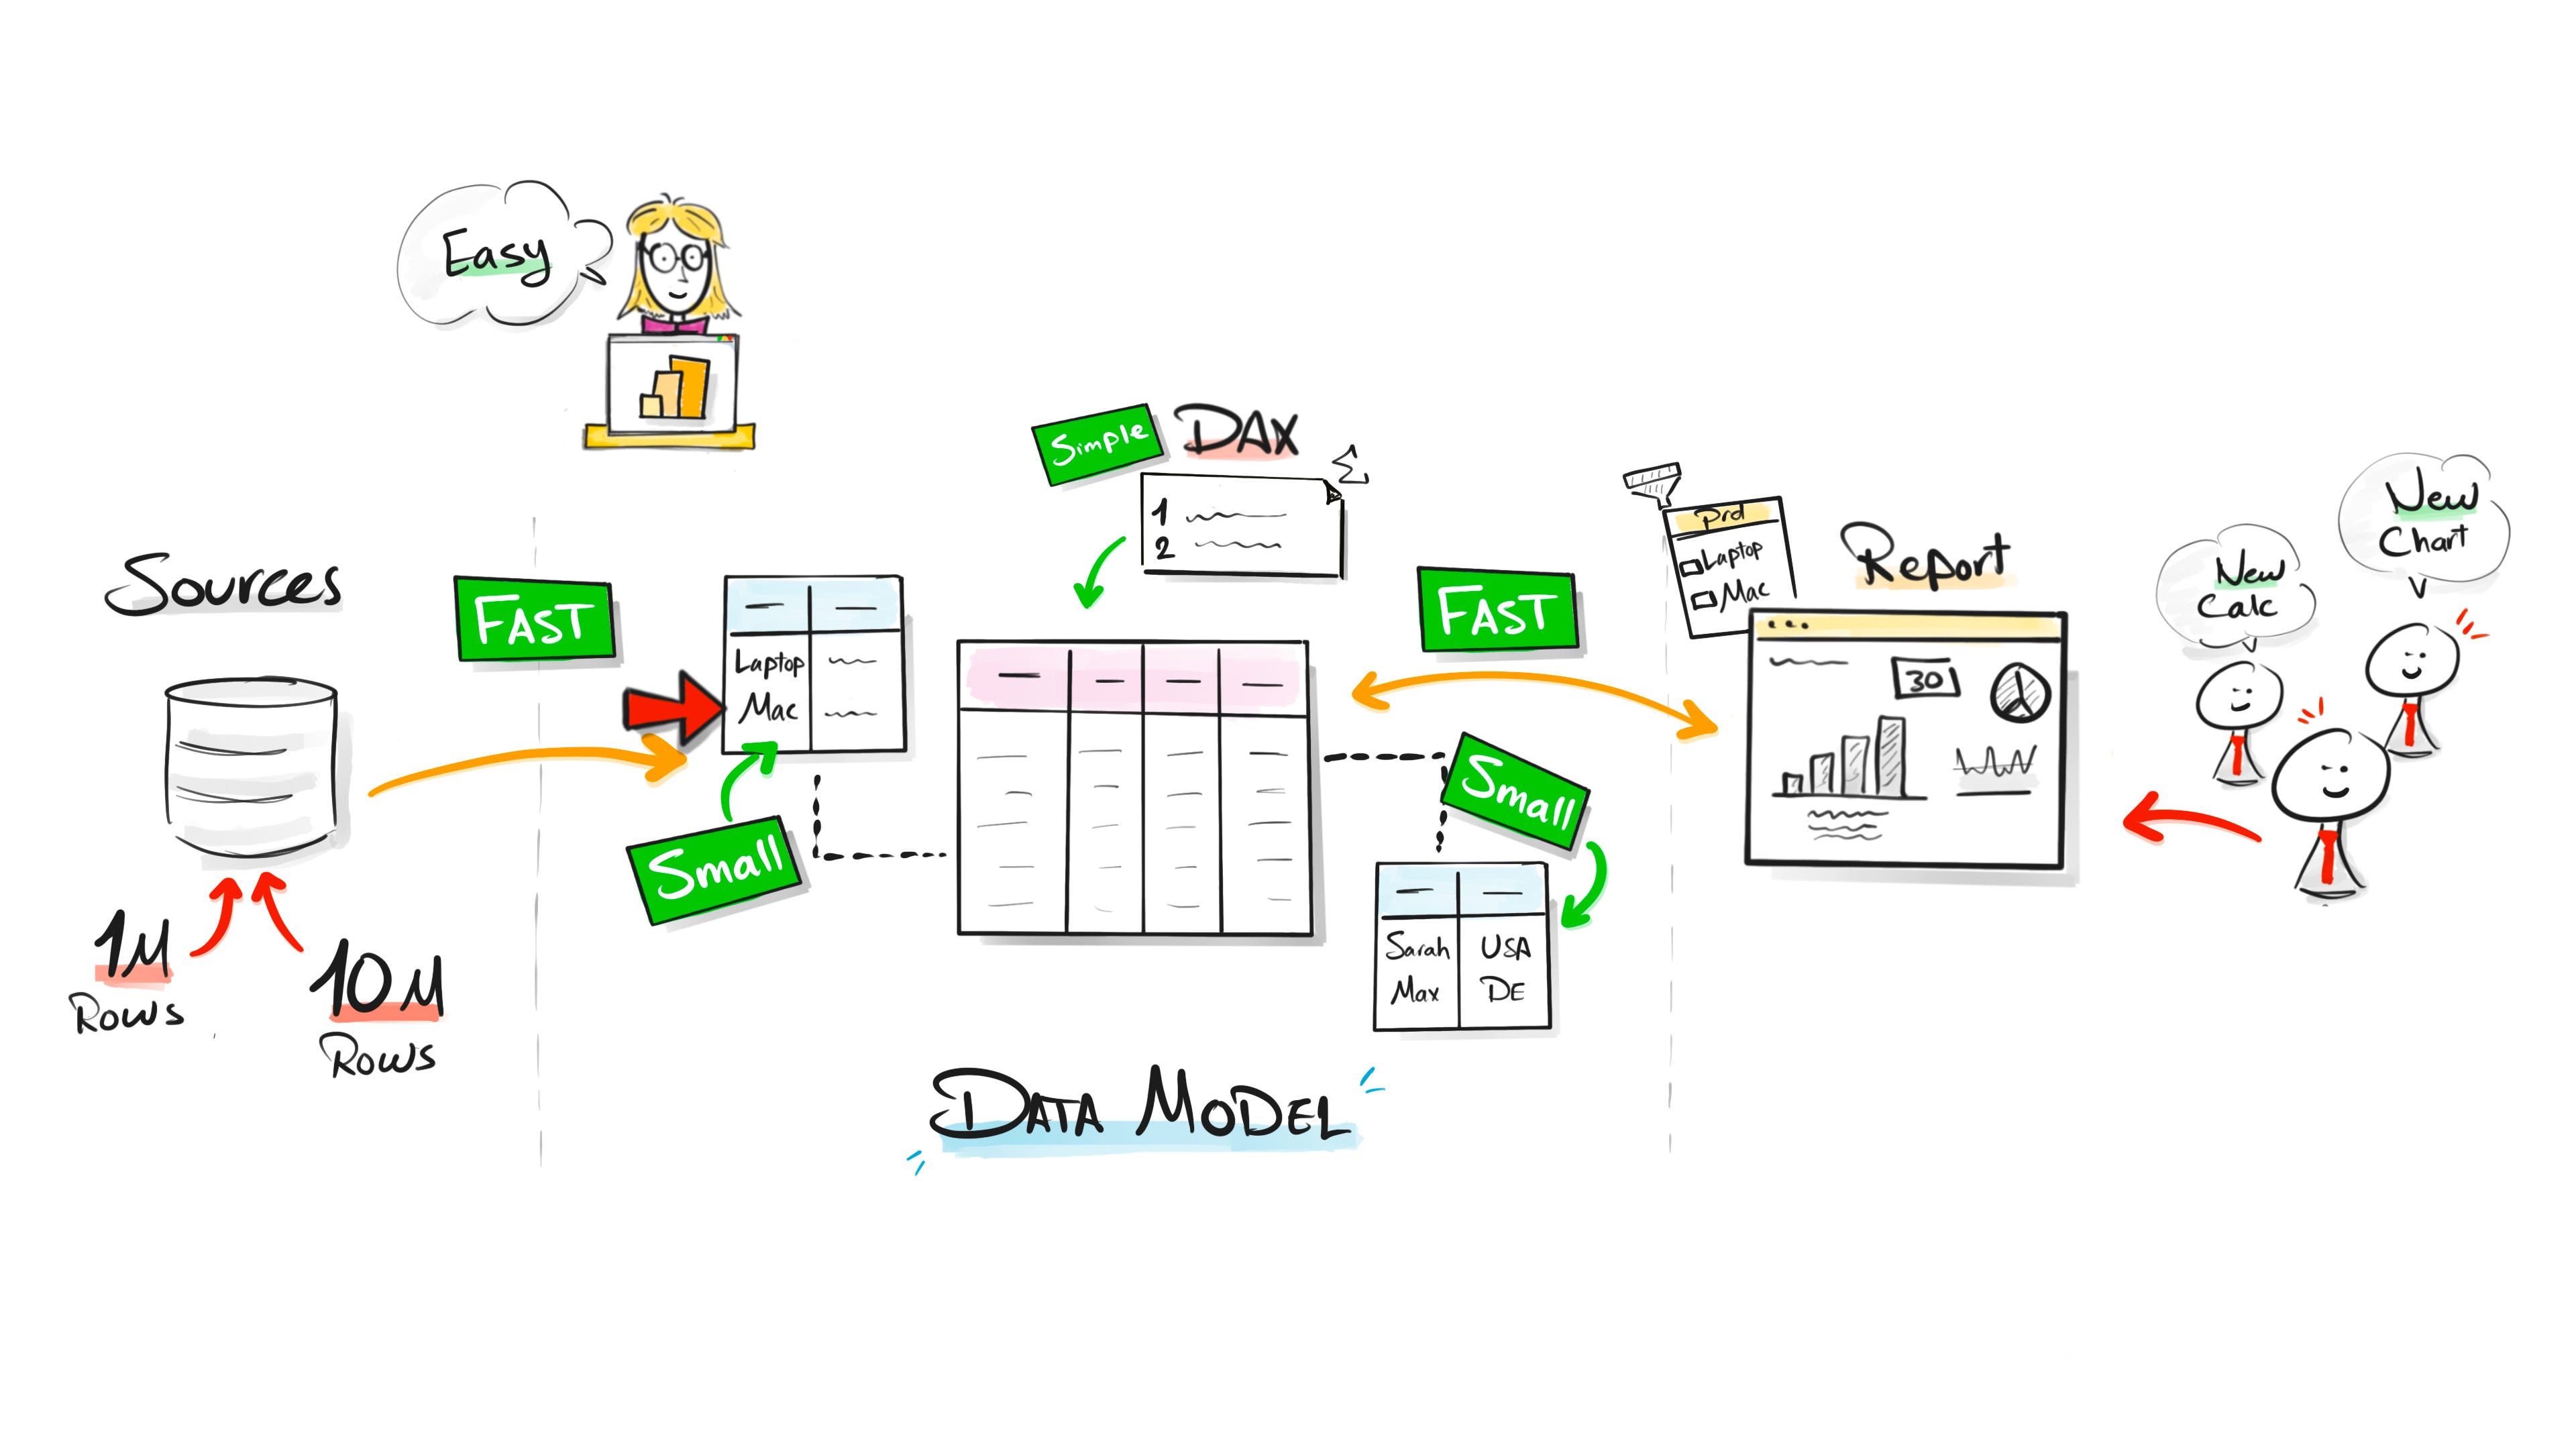
The fix isn’t complicated. Stop forcing everything into one table. Split the data into separate, meaningful tables and connect them with relationships.
Now each piece of information is stored once, in its own table, instead of repeating on every row. The big table only keeps what it actually needs.
That one change fixes the whole chain. The file gets small. The refresh gets fast. The reports get fast, because a slicer now reads a small table instead of scanning millions of rows. And the DAX gets simple, because the relationships do the heavy work for you.
The model and the relationships do half the work before you write a single measure.
The Bigger Danger: One Table for Every Report
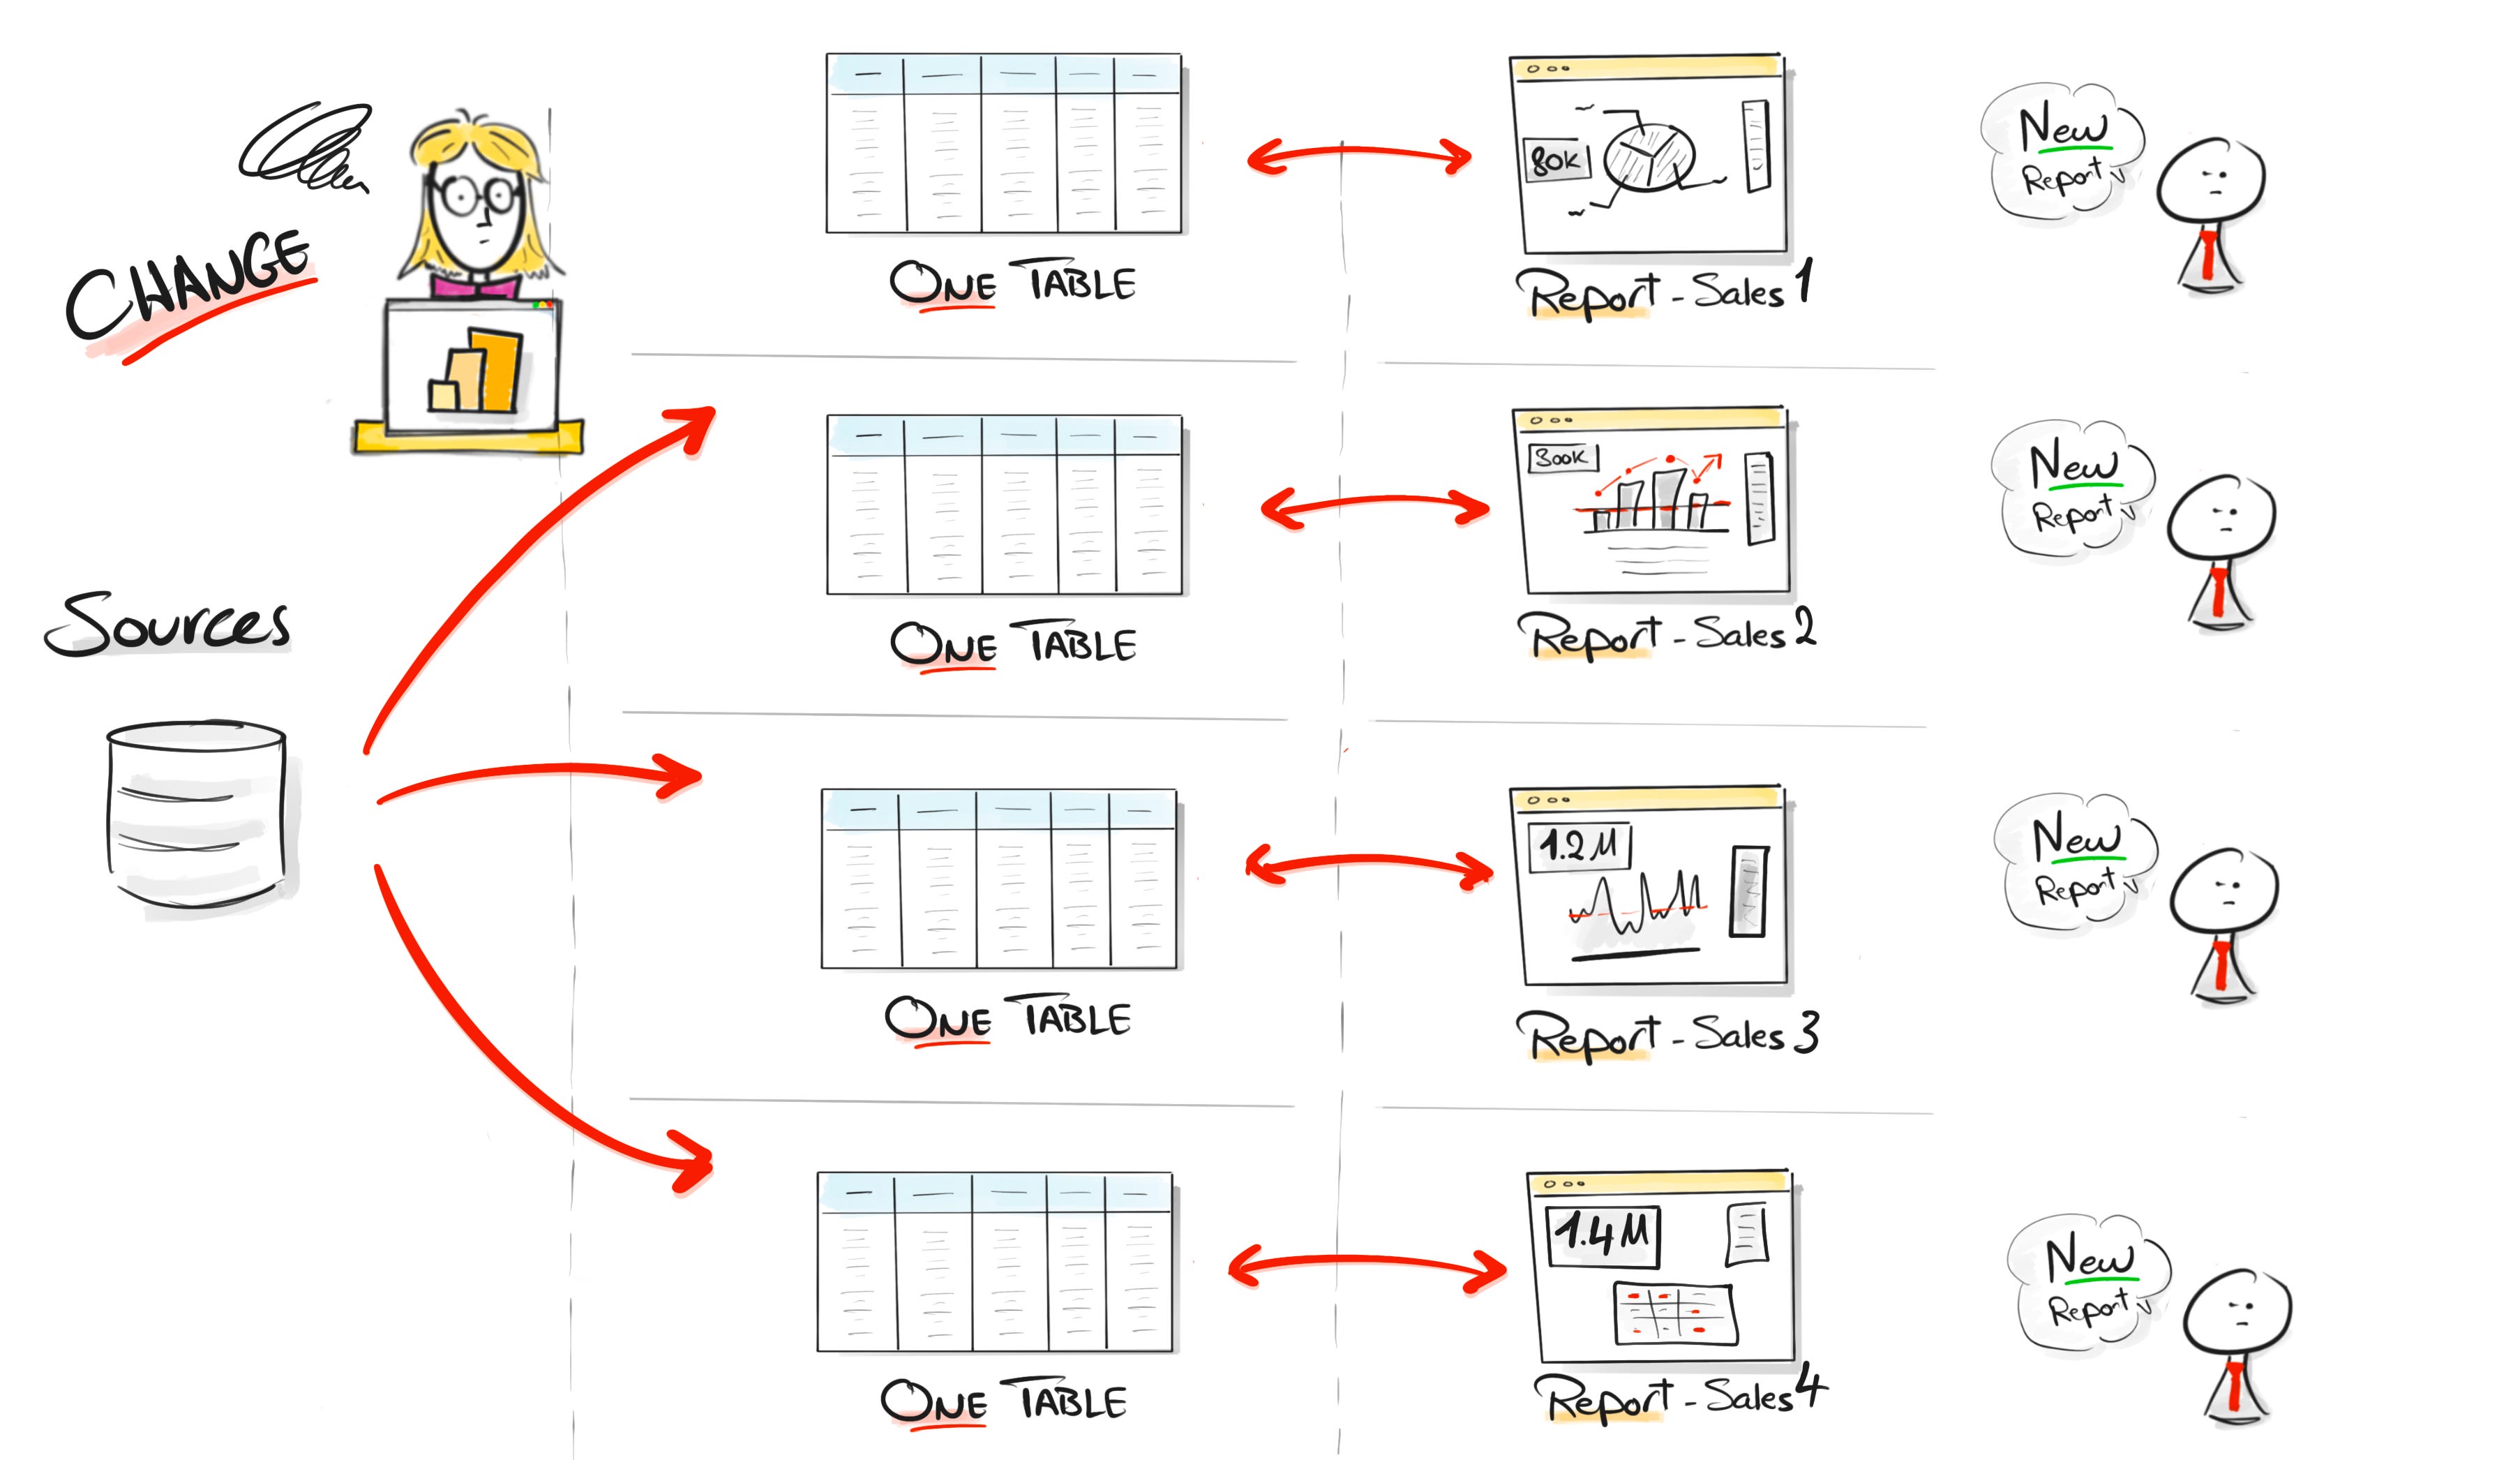
The technical problems are painful. But there’s a bigger one.
When you skip data modeling, you fall into a pattern. A user asks for a report, you build a table for that report. Another user asks for another report, you build another table. Another dashboard comes in, you do it again.
Over time every report has its own logic, its own transformations, its own version of the truth.
One report, one table. This is the beginning of the end.
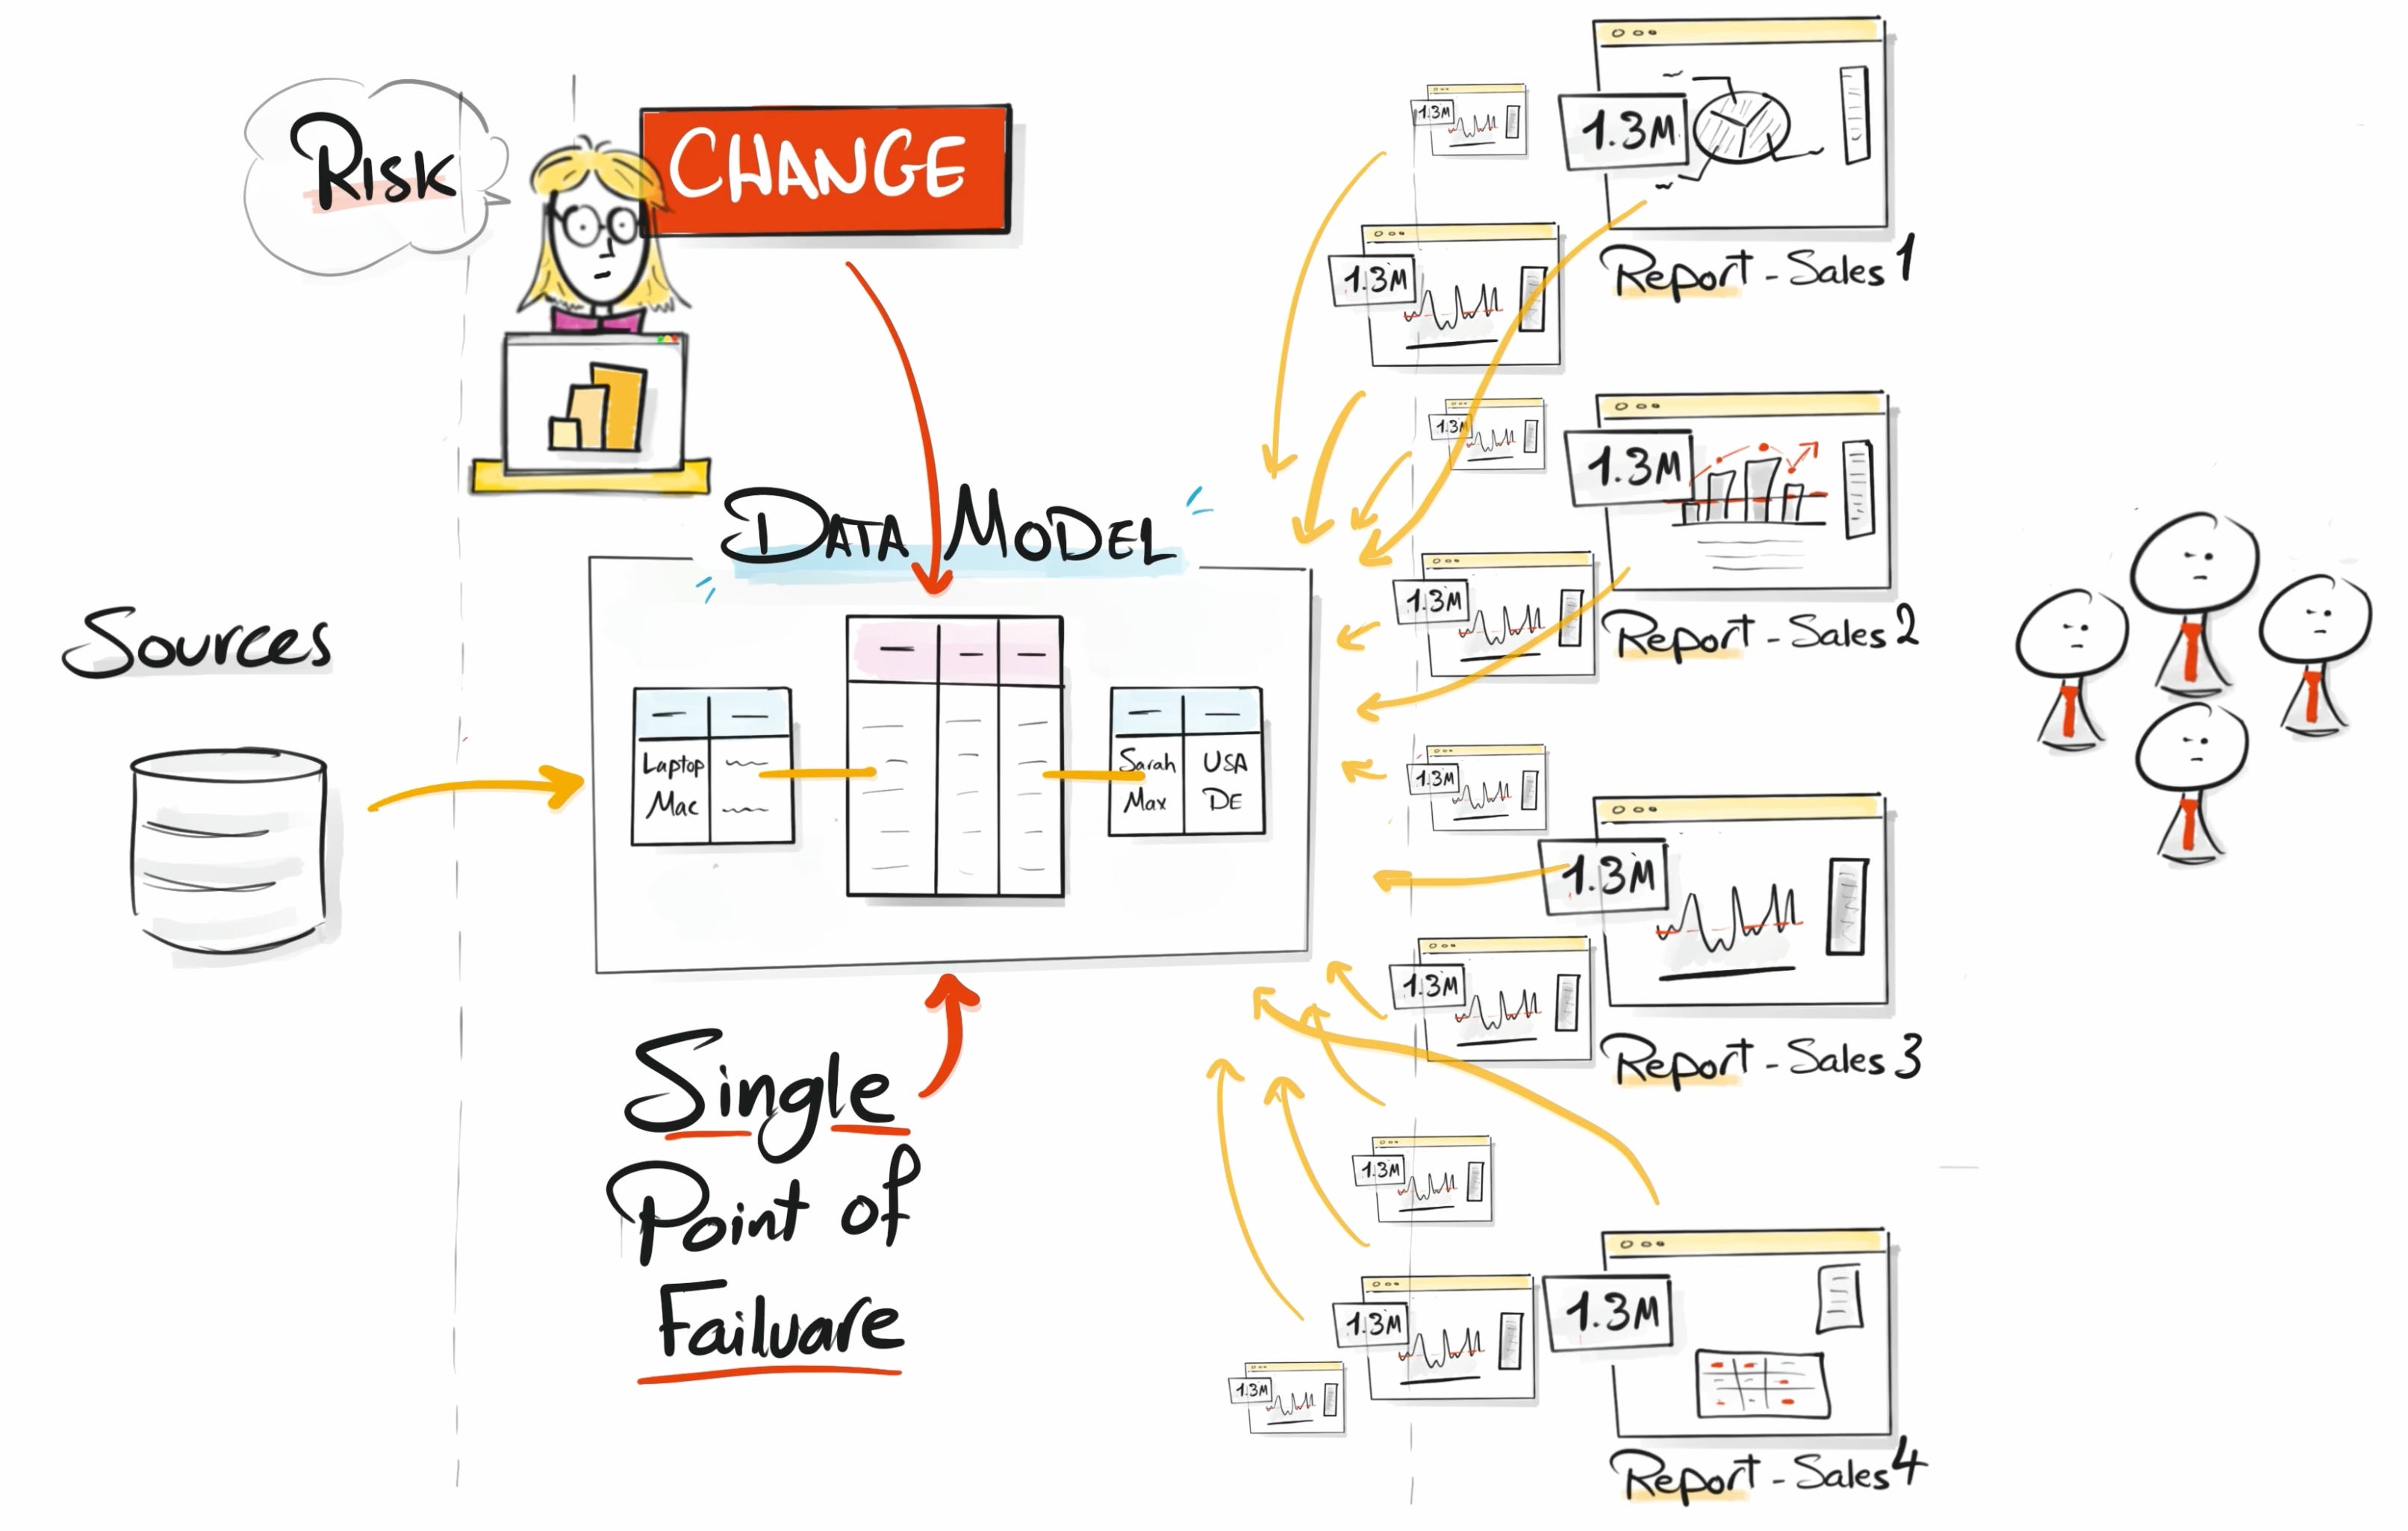
Maintenance Becomes a Nightmare
Say you find a mistake in the transformation logic. With one shared model, you fix it in one place. With one table per report, you open file after file and repeat the same fix everywhere, trying to keep them in sync.
That’s a lost battle. One day someone forgets a file. One measure changes in one place but not the other. Now the reports don’t match.
One report says 1.2 million. Another says 1.4 million. Same question, different answer. And when users see different numbers, they don’t care why. They just see Power BI giving them different numbers.
When the numbers don’t match, users stop trusting the whole project. And then they go back to Excel.
Build Around the Business, Not One Report
This is the real shift.
A flat table is built around one report. A data model is built around the business. Instead of asking “what columns do I need for this one report?”, you ask “what does the business actually need to answer?”
Then you build a model that can answer many questions, not just one dashboard request. One model serves many reports. Fix a calculation once, every report using it stays correct.
That’s where consistency comes from. And consistency is what builds trust.
But Should Everything Use One Giant Model?
No. This is where people go to the other extreme.
They hear “shared model” and build one giant model for the whole company. Everything depends on it, so changing one measure feels terrifying because it can hit dozens of reports at once.
So the answer is the middle:
Not one table per report. Not one model for the whole company. One shared model per domain.
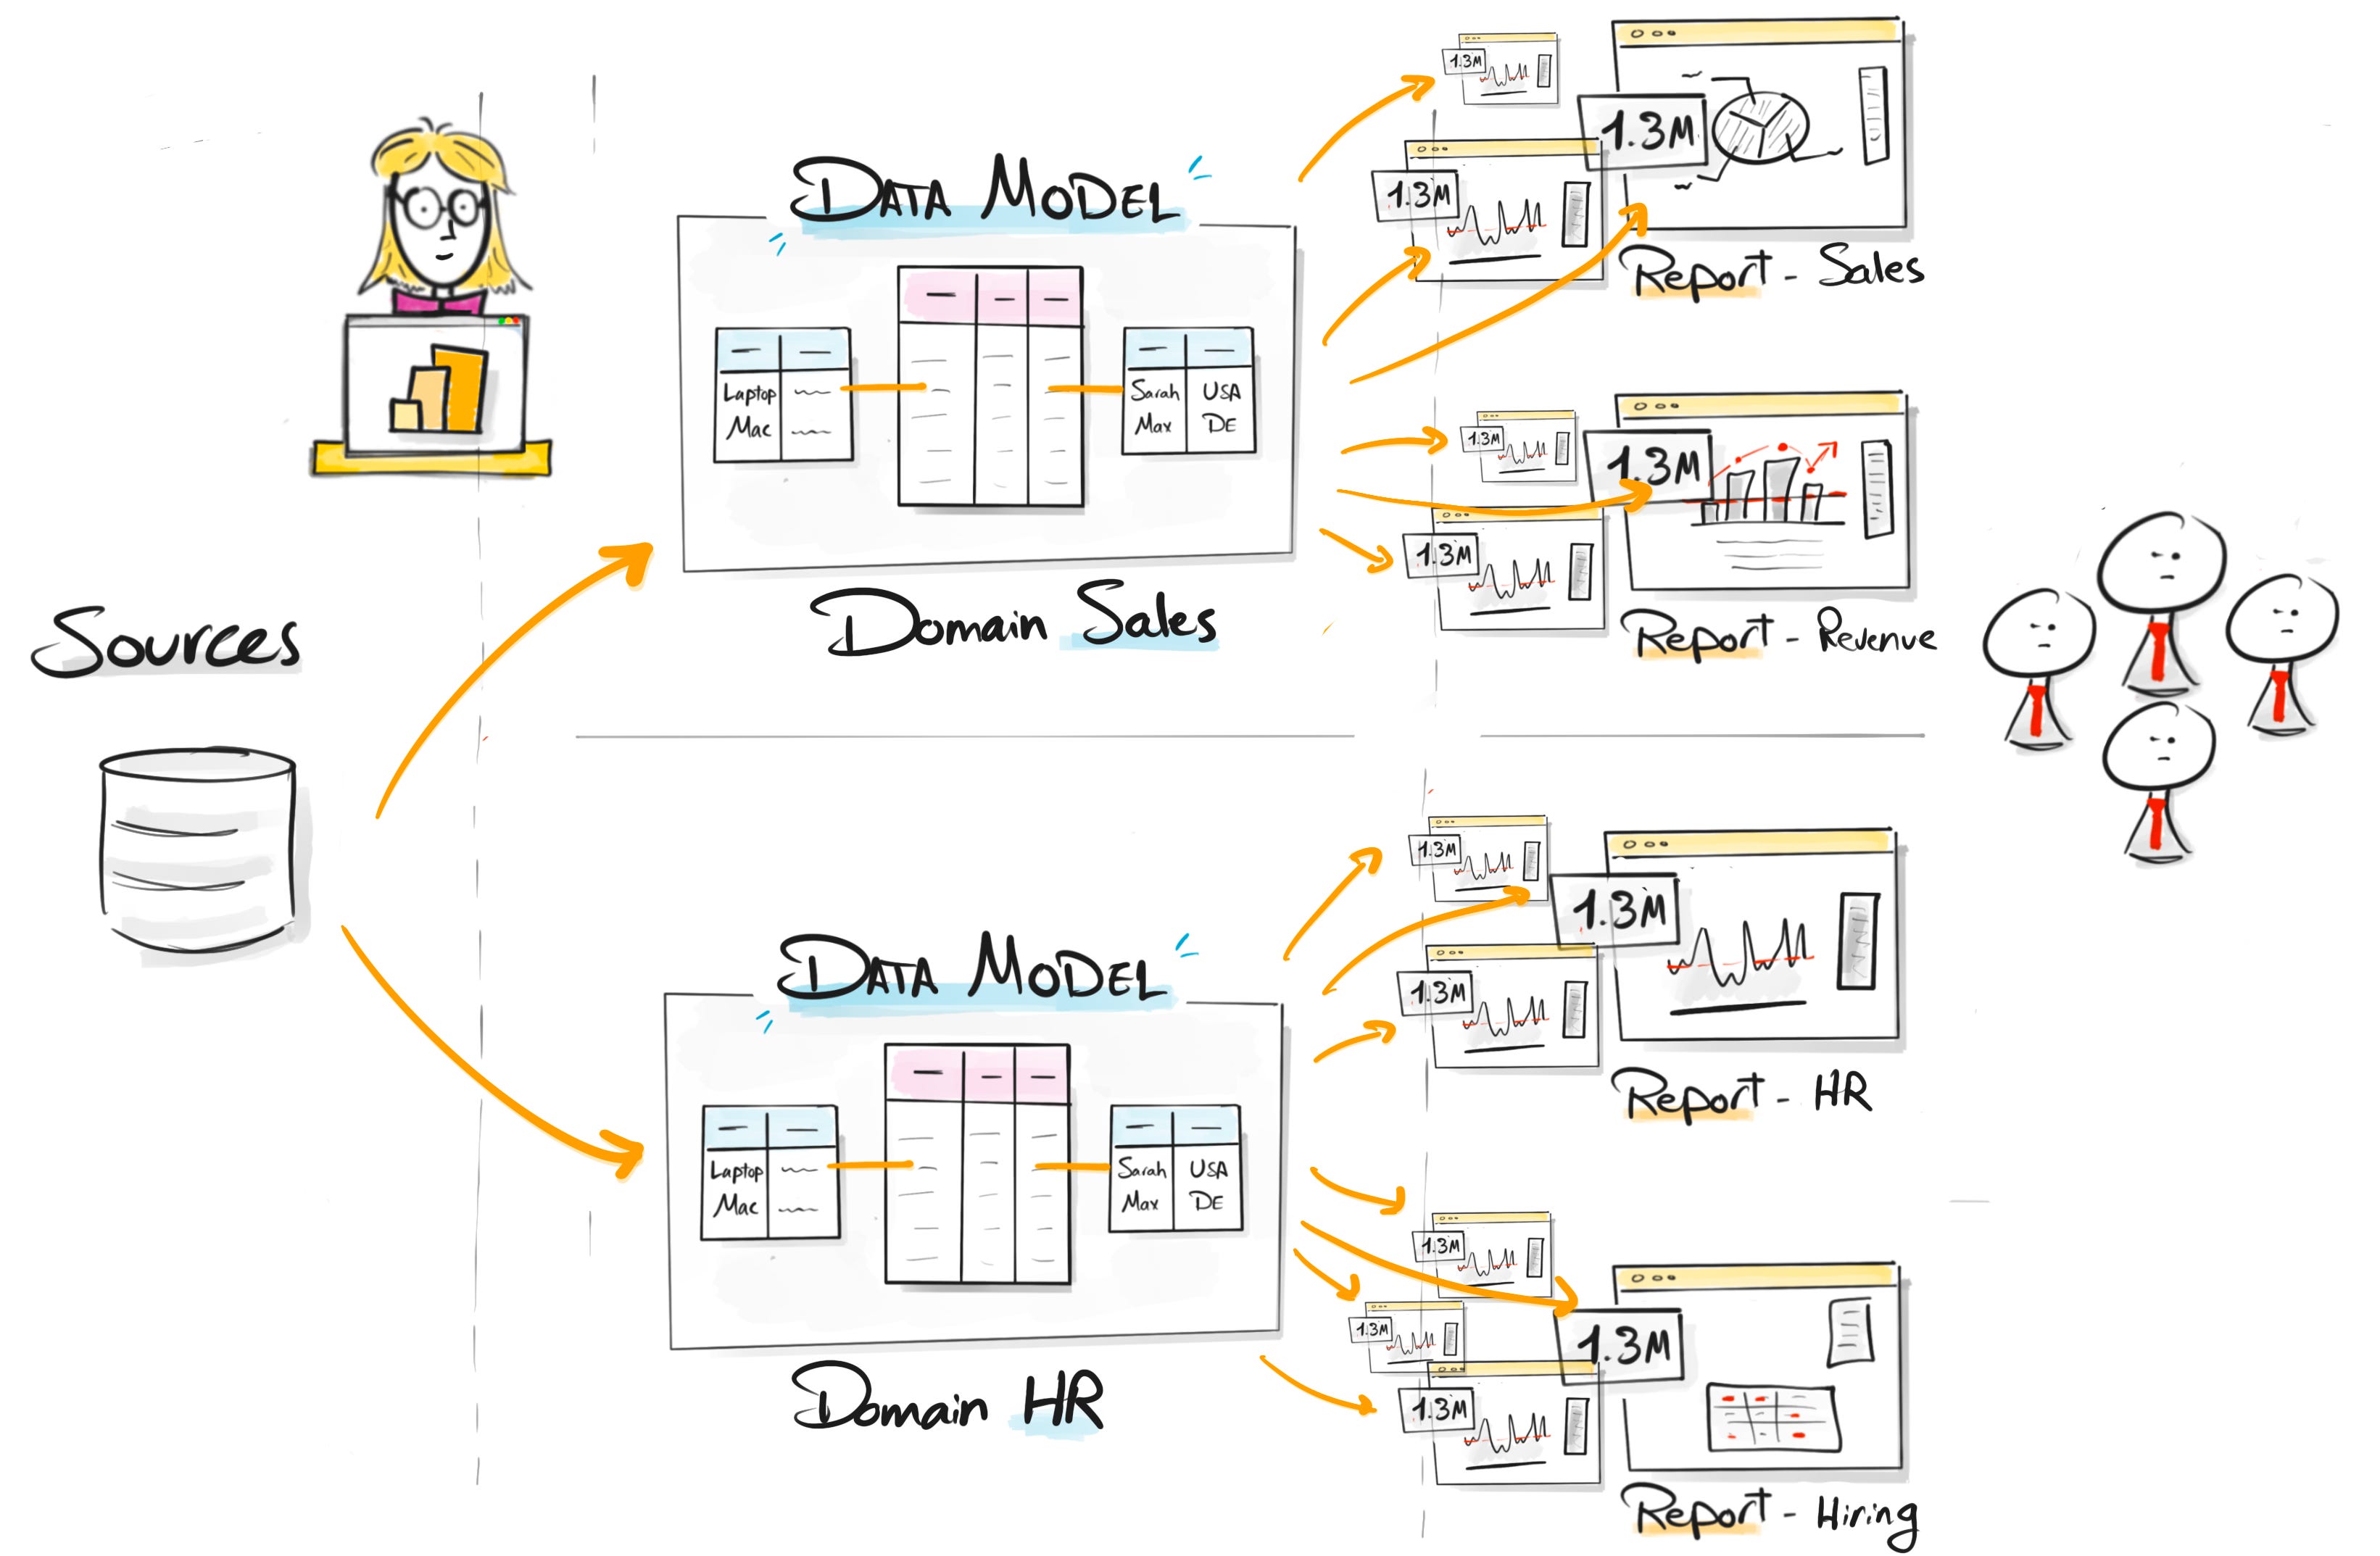
One model per domain, each serving a group of related reports. You get the reuse without turning the whole company into one fragile model.
Quick Recap
Bad data models create technical problems:
Large Power BI files
Slow refresh
Slow reports
Complicated DAX
And project problems:
Repeated work
Hard maintenance
Different KPI numbers
Users losing trust
Data modeling takes time. But skipping it is more expensive. Your report might work today with one big table. Over time, that shortcut becomes the reason the project fails.
If the model is weak, the project is weak.
In the next videos we go deeper. What data modeling actually means, the different model types, and how to build clean, fast Power BI models, step by step with the sketches.
Watch the new chapter here: [VIDEO LINK]
Thanks for reading ❤️
Baraa
Also, here are 4 complete roadmap videos if you’re figuring out where to start:
📌 Data Engineering Roadmap
📌 Data Science Roadmap
📌 Data Analyst Roadmap
📌 AI Engineering Roadmap

Hey friends —
Hey, I’m Baraa, a Data Engineer with over 17 years experience, Ex-Mercedes Benz, where I led and built one of the biggest data platforms for analytics and AI.
Now I’m here to share it all through visually explained courses, real-world projects, and the skills that will get you hired. I’ve helped millions of students transform their careers.
Easy on the eye. The post didn't feel overwhelming, instead I read through it while having my coffee before a gym session.