
Tableau vs Power BI: Why Power BI Is Taking Over
When Power BI makes sense and when Tableau still wins

Hey friends - Happy Thursday!
If you’ve been around data for a while, you’ve probably noticed it.
There’s an endless debate about Power BI vs Tableau.
I see it on YouTube. On social media. Inside companies.
People compare features, prices, visuals, performance. And the question always comes up.
Which one is better?
Here’s my honest answer.
Both are good.
I’ve worked on projects where we used only Power BI.
Other projects where we used only Tableau.
And I’ve even worked on a project where we used both at the same time.
That’s not strange at all. That’s just how analytics works. Different problems need different tools.
But something interesting has been happening over the last few years.
Since around 2021, I’ve seen a clear shift in many companies toward Power BI.
Not because Tableau suddenly became bad.
But because Power BI fits better into how most teams actually work.
Let me explain what I keep seeing in real projects.
Why many teams choose Power BI
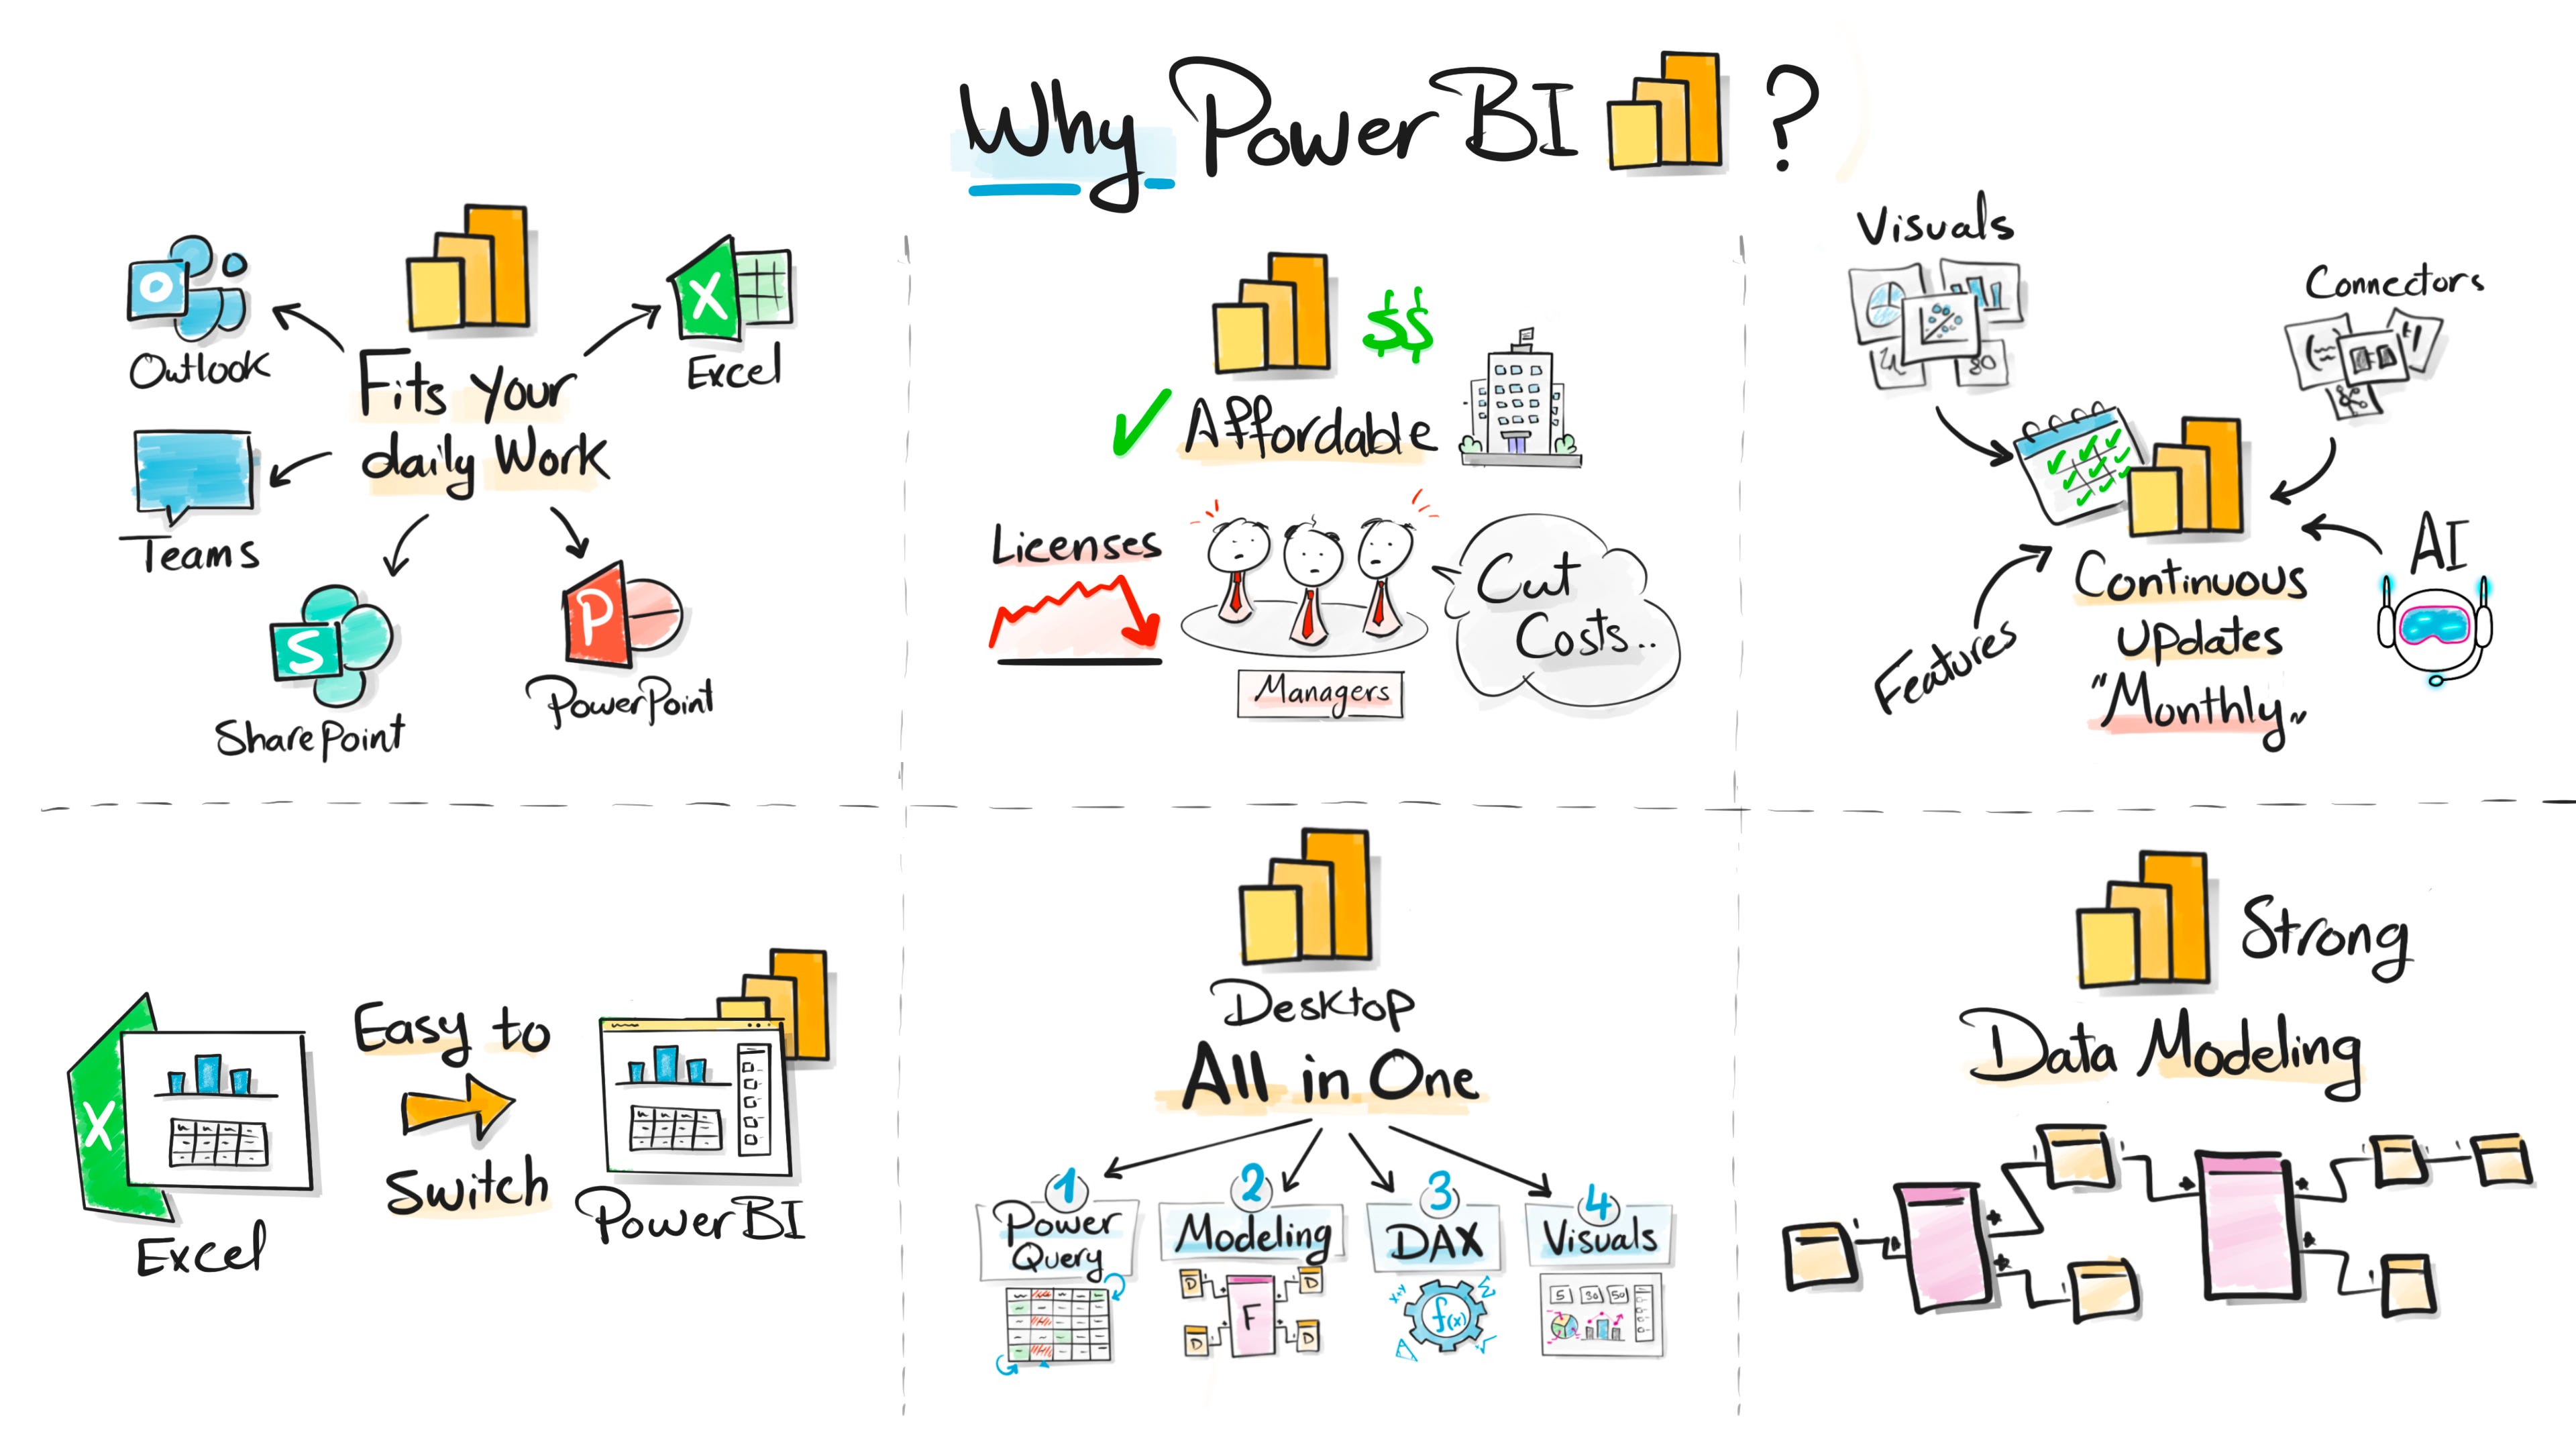
It fits naturally into daily work tools
Power BI fits right into how most teams already work.
Outlook. Teams. Excel. PowerPoint. SharePoint.
Power BI feels familiar from day one. It looks like Excel. It feels like PowerPoint. And it connects to these tools without extra effort.
If you ever opened Power BI and thought, this feels familiar, that’s the reason.
Switching from Excel is easier than expected
If you already use Excel, you’re not starting from zero.
A lot of the logic feels familiar.
DAX feels familiar. The interface feels familiar. Even the charts feel familiar.
That makes the switch much easier for most people.
Cost matters more than people admit
Licenses are a big part of company budgets. Especially now.
Power BI is simply more affordable than many other tools.
For a lot of teams, that alone makes the decision easier.
Everything in one place
With Power BI Desktop, you do everything in one tool.
You clean data. Prepare it. Model it. And build reports.
Power Query is already there.
With other tools, you often need an extra product just for preparation. That means more tools, more licenses, and more context switching.
Easy integration with cloud platforms
This one shows up a lot in real projects.
Power BI fits very naturally into cloud platforms, especially Azure.
Azure SQL. Synapse. Data Factory. Data Lake. Fabric. Everything connects smoothly.
For teams already running on Azure, Power BI often feels like the default choice.
Less setup. Fewer connectors. Fewer surprises.
It also plays well with modern data stacks.
Lakehouses. Incremental refresh. Semantic models. Row-level security.
That tight cloud integration makes life easier for data engineers and BI teams.
And over time, that simplicity matters more than people expect.
Microsoft keeps investing in it
Microsoft clearly puts a lot of focus on Power BI.
There are updates every month. New features. New visuals. New connectors.
You can feel the tool evolving fast.
Strong data modeling
This is my favorite part.
Power BI is very strong when it comes to data modeling.
You can build proper models, relationships, and measures that scale well.
When the model is strong, everything else becomes easier.
Compared to that, Tableau is more limited in how you model data. And in real projects, this makes a big difference.
Where Power BI struggles
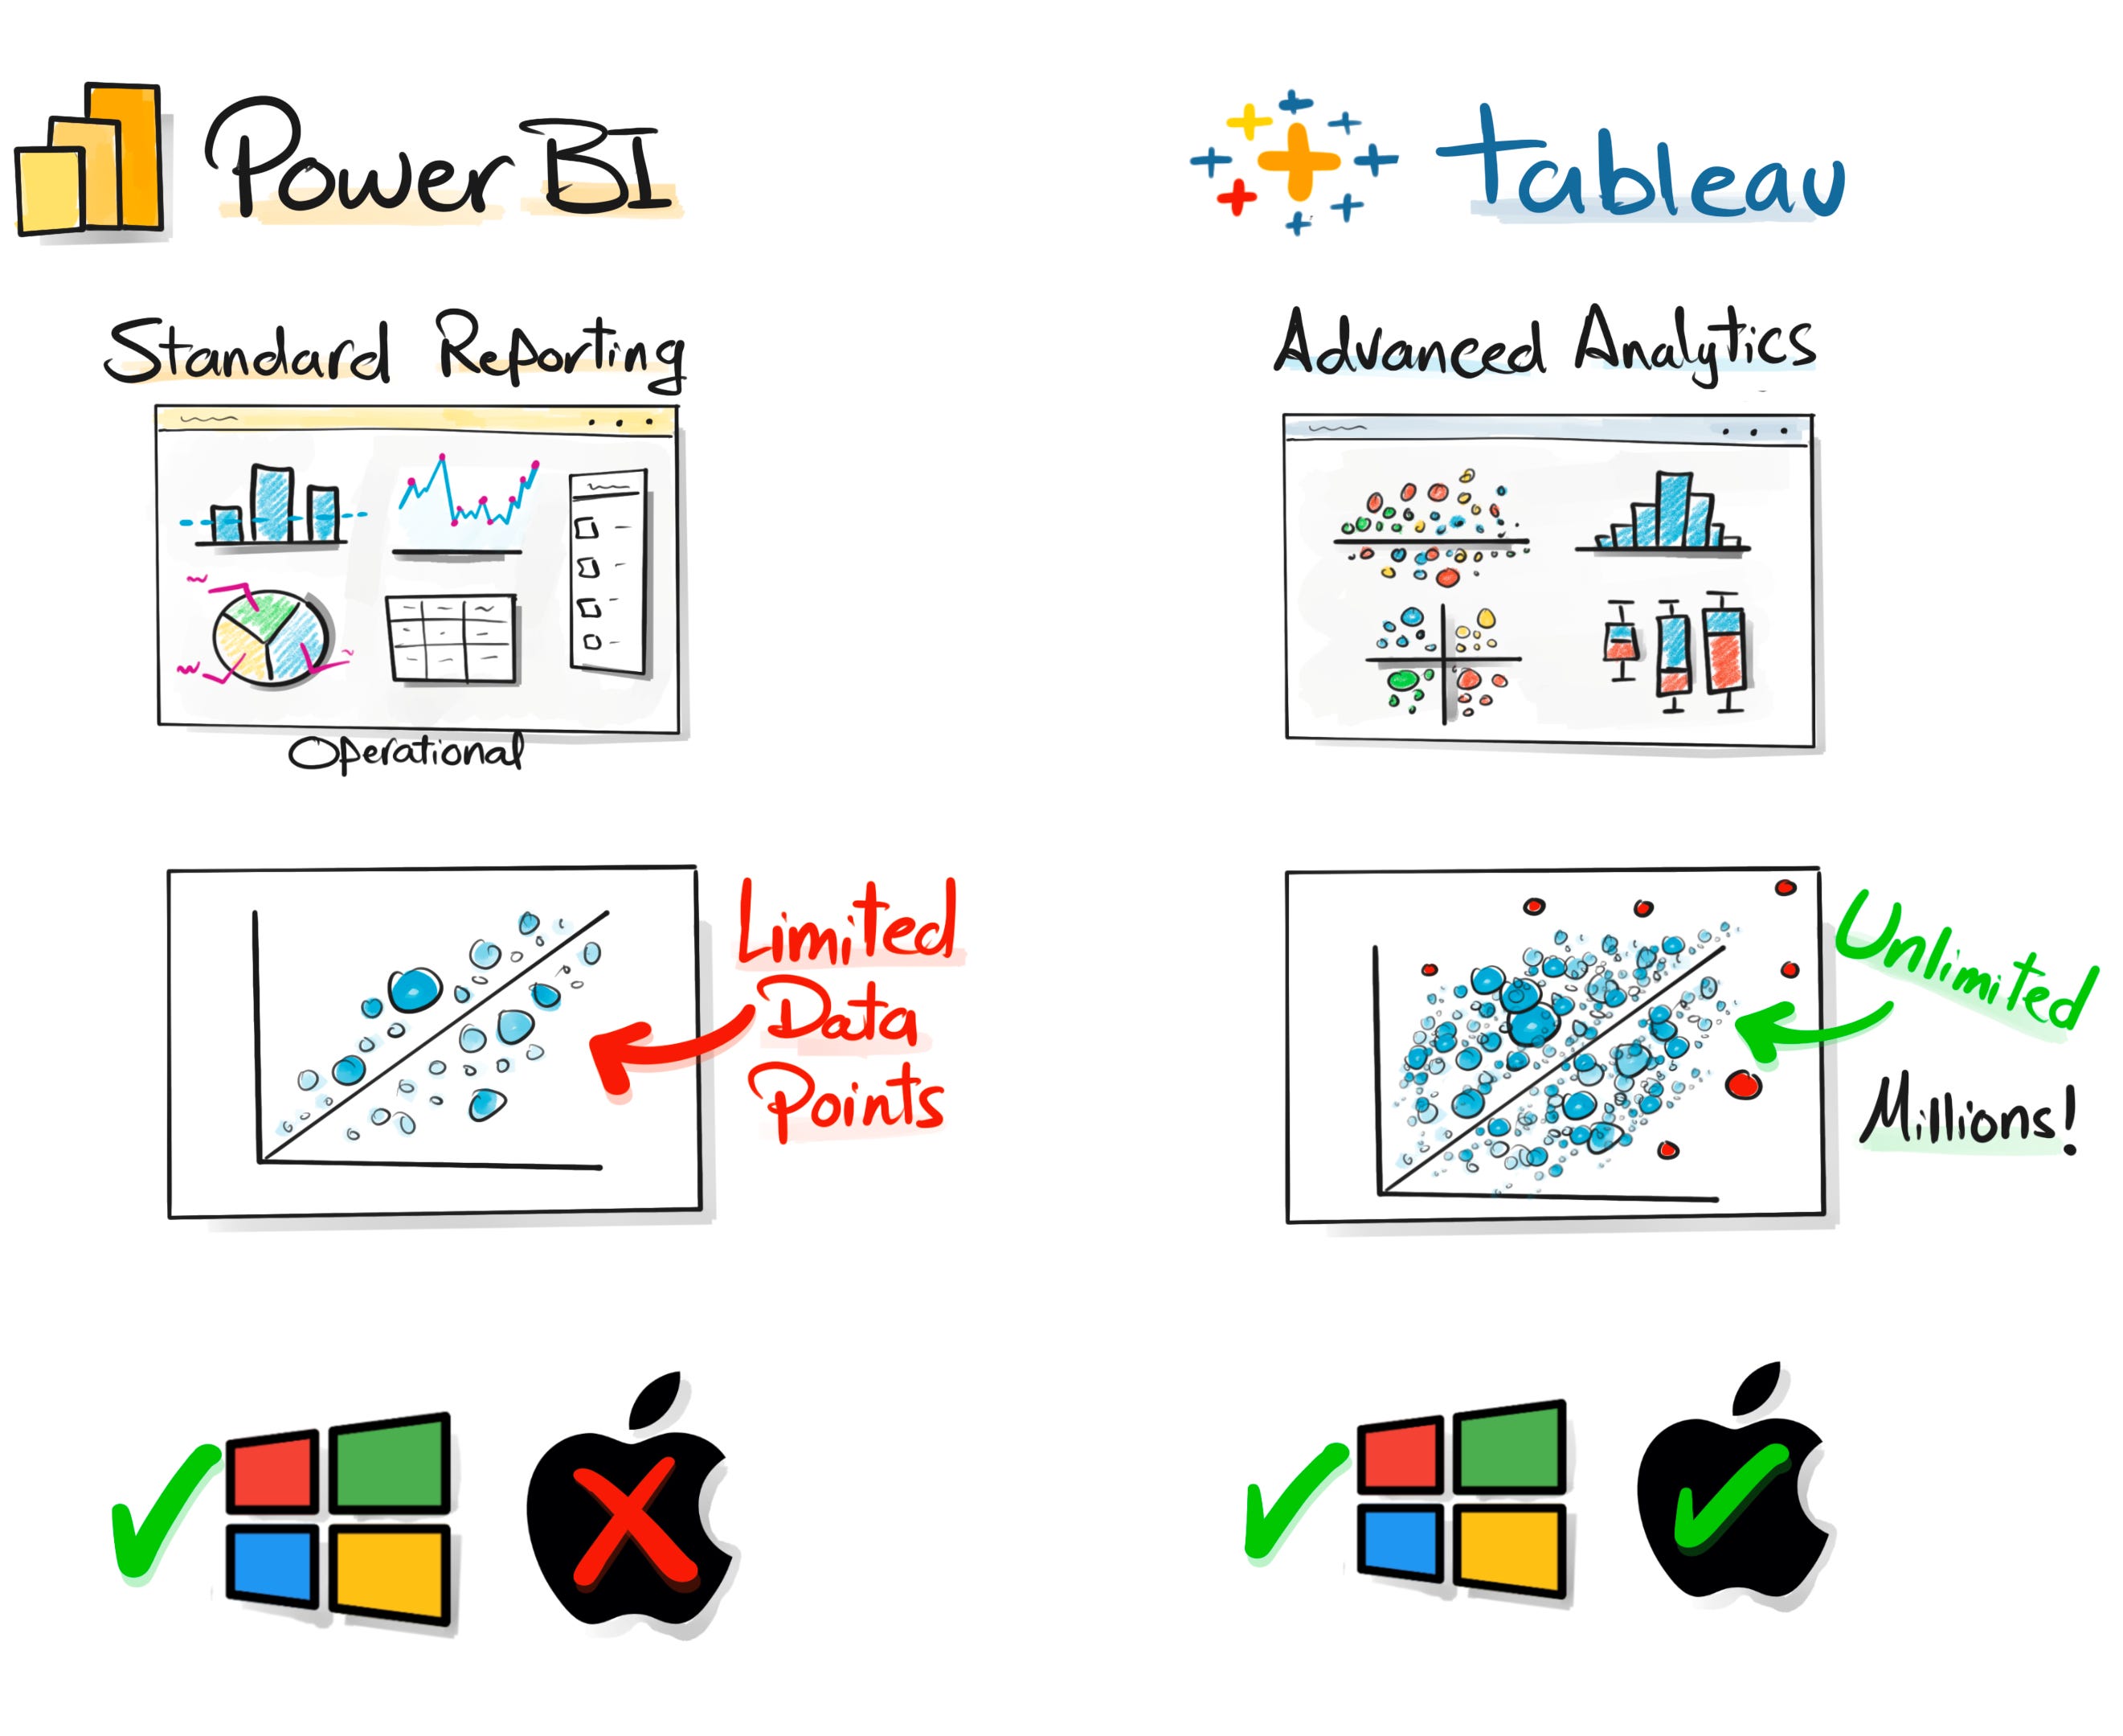
Complex visuals can feel limiting
For basic operational reports, Power BI works great.
Bar charts, line charts, tables, filters. No problem.
But once you move into advanced analytical visuals, things change.
If you’re a data scientist building dot plots or exploring complex patterns, Tableau is often faster and more flexible. It still wins there.
Data point limits are a real issue
This one comes up often.
In Power BI, visuals like scatter charts are limited to a few thousand points.
That makes it hard to explore large datasets or spot outliers properly.
In Tableau, I’ve built visuals showing millions of points. No hard limits. No workarounds.
Mac users need workarounds
Power BI Desktop does not run natively on Mac.
You always need a workaround.
With Tableau, you install it and it just works. Windows or Mac.
Why we sometimes use both
These limits are exactly why, in one project, we used both tools together.
Each tool solved a different problem.
And that’s often the smartest approach in real analytics work.
How To choose between Tableau and Power BI
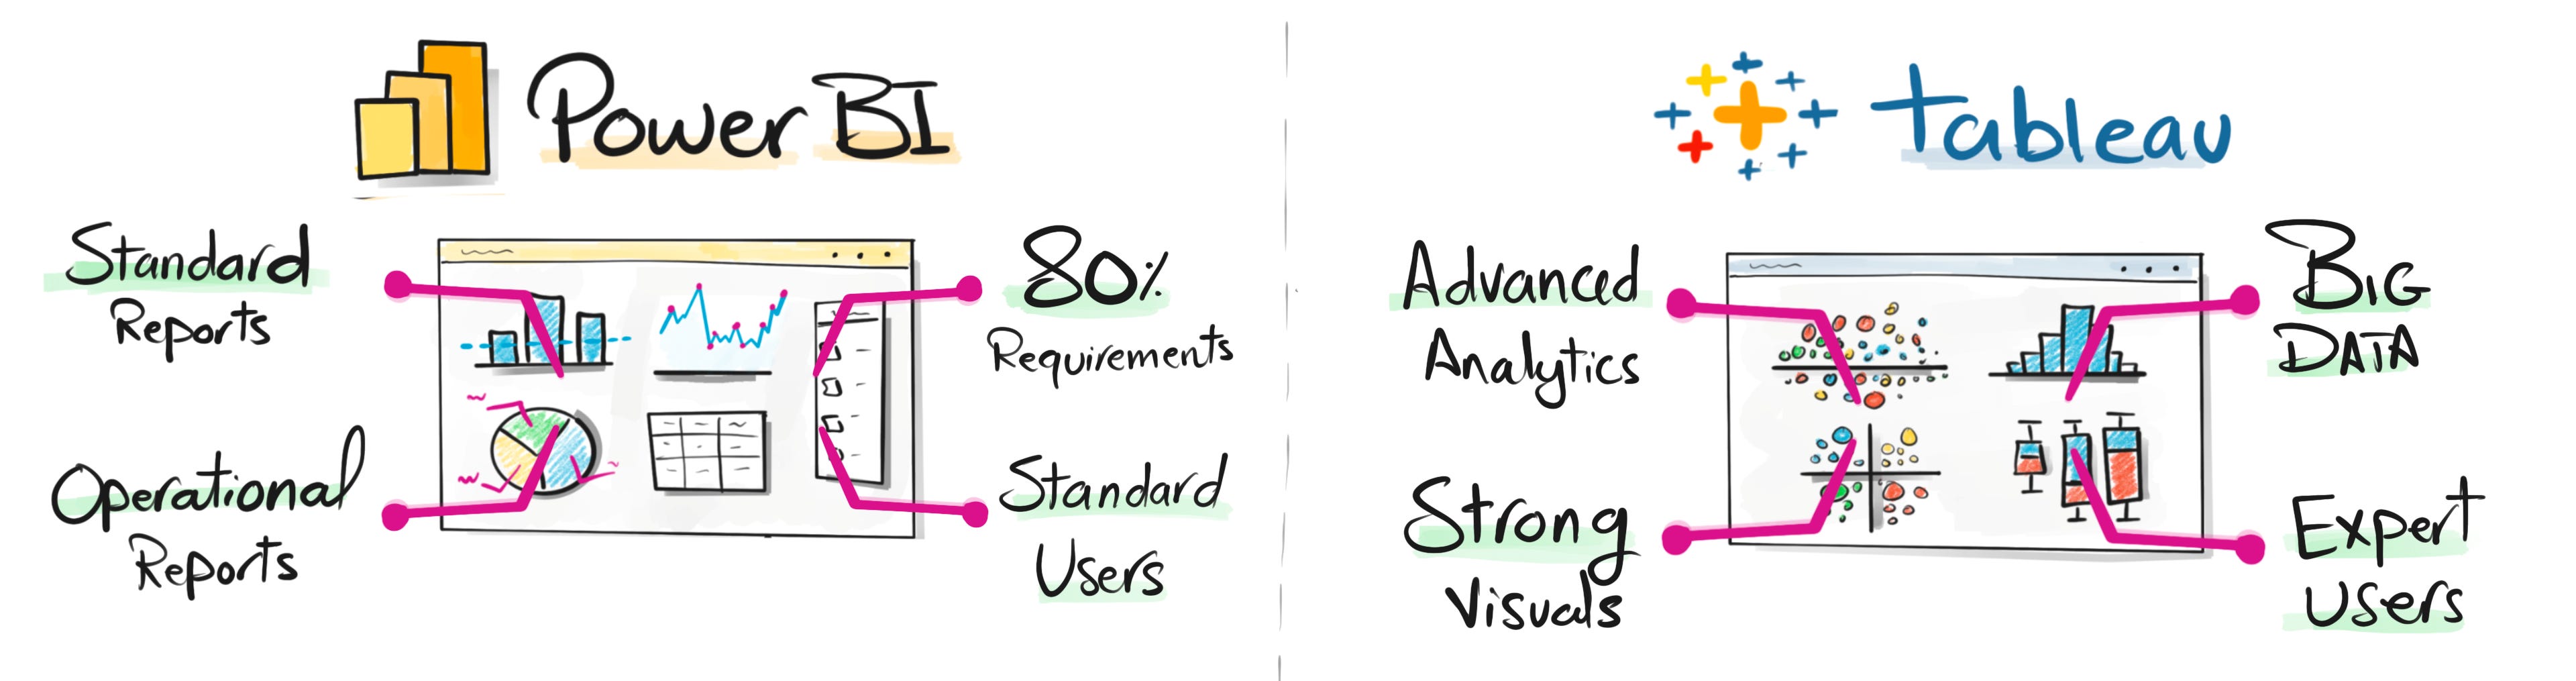
Power BI fits most everyday reporting
Power BI sits where most reporting actually happens.
Standard reports
Operational dashboards
KPIs for managers and leaders
This easily covers around 80 percent of reporting needs in most companies.
The users here are usually standard business users.
They want clear numbers and quick answers, not complex exploration.
Power BI works well because it is structured, easy to maintain, and easy to share.
Tableau shines in advanced analytics
Tableau lives in a different space.
Advanced analytics
Highly customized visuals
Large datasets and big data
This is usually used by expert users.
Analysts and data scientists who explore data deeply.
Here, Tableau feels faster and more flexible.
You can experiment more and push visuals much further.
Two tools, two roles
This is why I don’t see it as a fight.
Power BI dominates standard and operational reporting.
Tableau shines in advanced analytical exploration.
They solve different problems for different users.
But things are shifting.
As more companies move to the cloud, especially around Microsoft and Azure, Power BI is becoming the default choice for many teams. Not because it replaces everything, but because it fits most everyday needs better.
And since most reporting in real companies is still standard and operational, Power BI naturally keeps gaining ground.
Thanks for reading, and I wish you all a happy Christmas and a great New Year.
Have a wonderful day ❤️
Baraa
By the way, I’ve started a new full Power BI course where I deep dive into the topics I mentioned here. You can follow the series here.
Also, here are 4 complete roadmap videos if you’re figuring out where to start:
📌 Data Engineering Roadmap
📌 Data Science Roadmap
📌 Data Analyst Roadmap
📌 AI Engineering Roadmap

Hey friends —
I’m Baraa. I’m an IT professional and YouTuber.
My mission is to share the knowledge I’ve gained over the years and to make working with data easier, fun, and accessible to everyone through courses that are free, simple, and easy!